Reporting & Business Intelligence

Every financial insight,
always ready

From Balance Sheets and Profit & Loss to Tax Summaries and Cash Flow. MAAB generates audit-ready reports in real time, with no manual compilation required.
17 report types Auditor-ready output Bilingual Arabic & English
MAAB · Reports
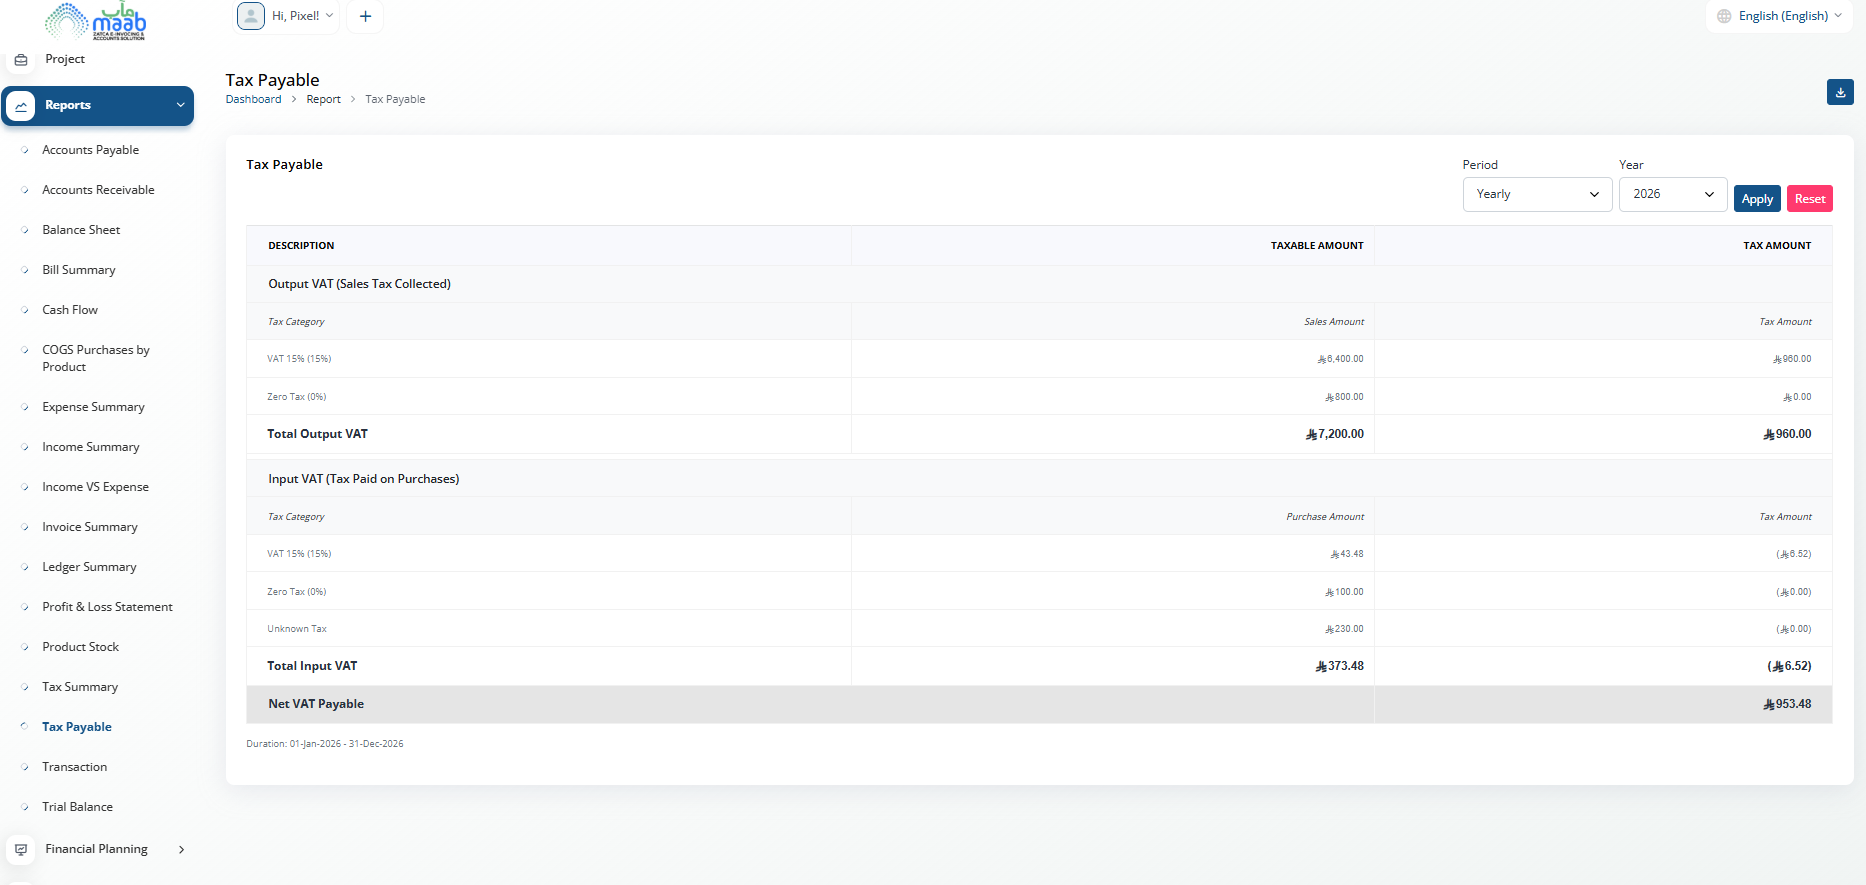
Tax Report
MAAB · Reports
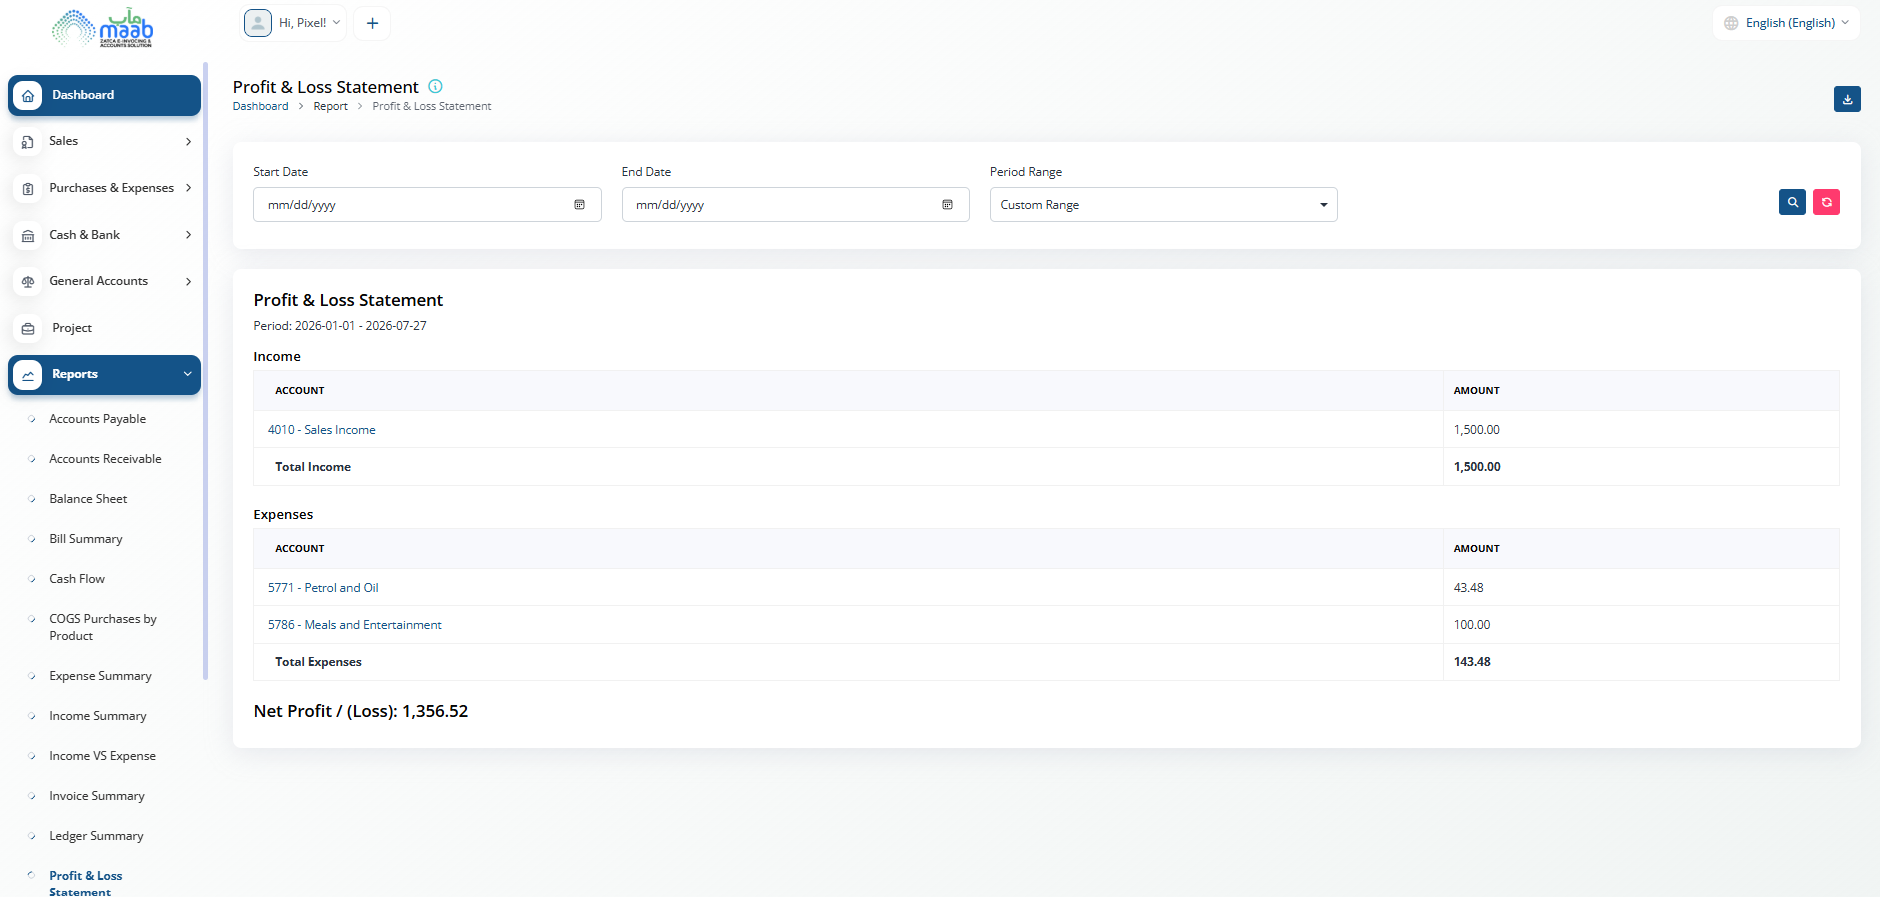
Profit & Loss Statement
MAAB · Reports
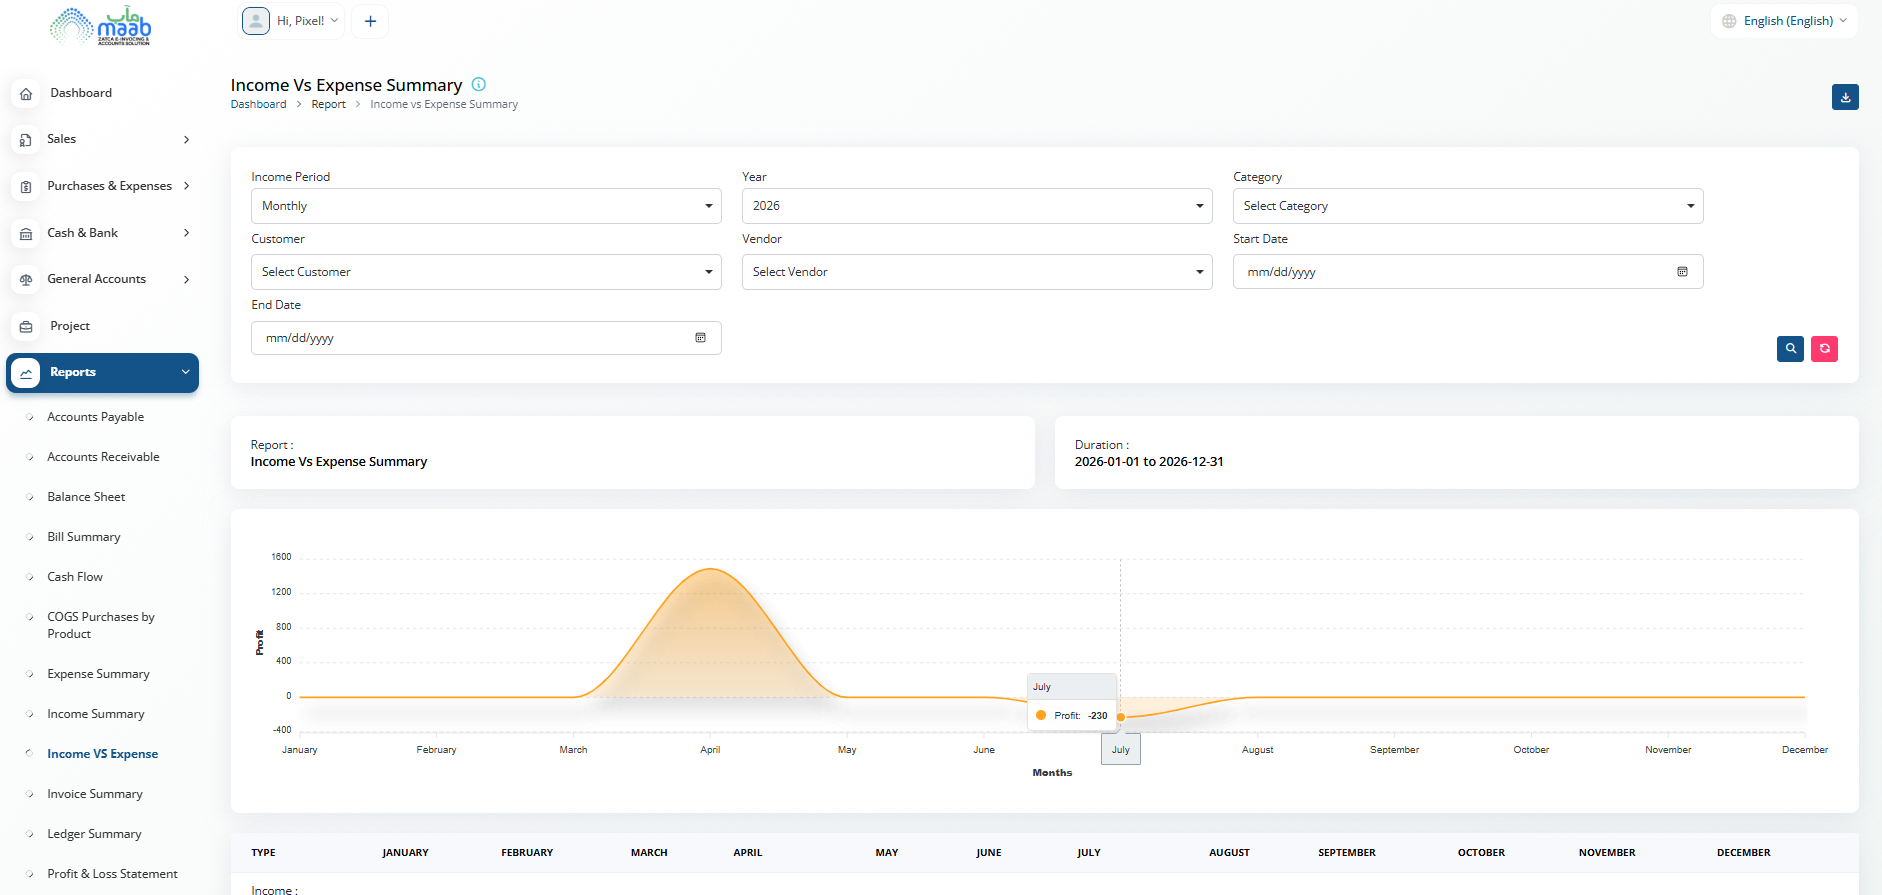
Income vs Expense
MAAB · Reports
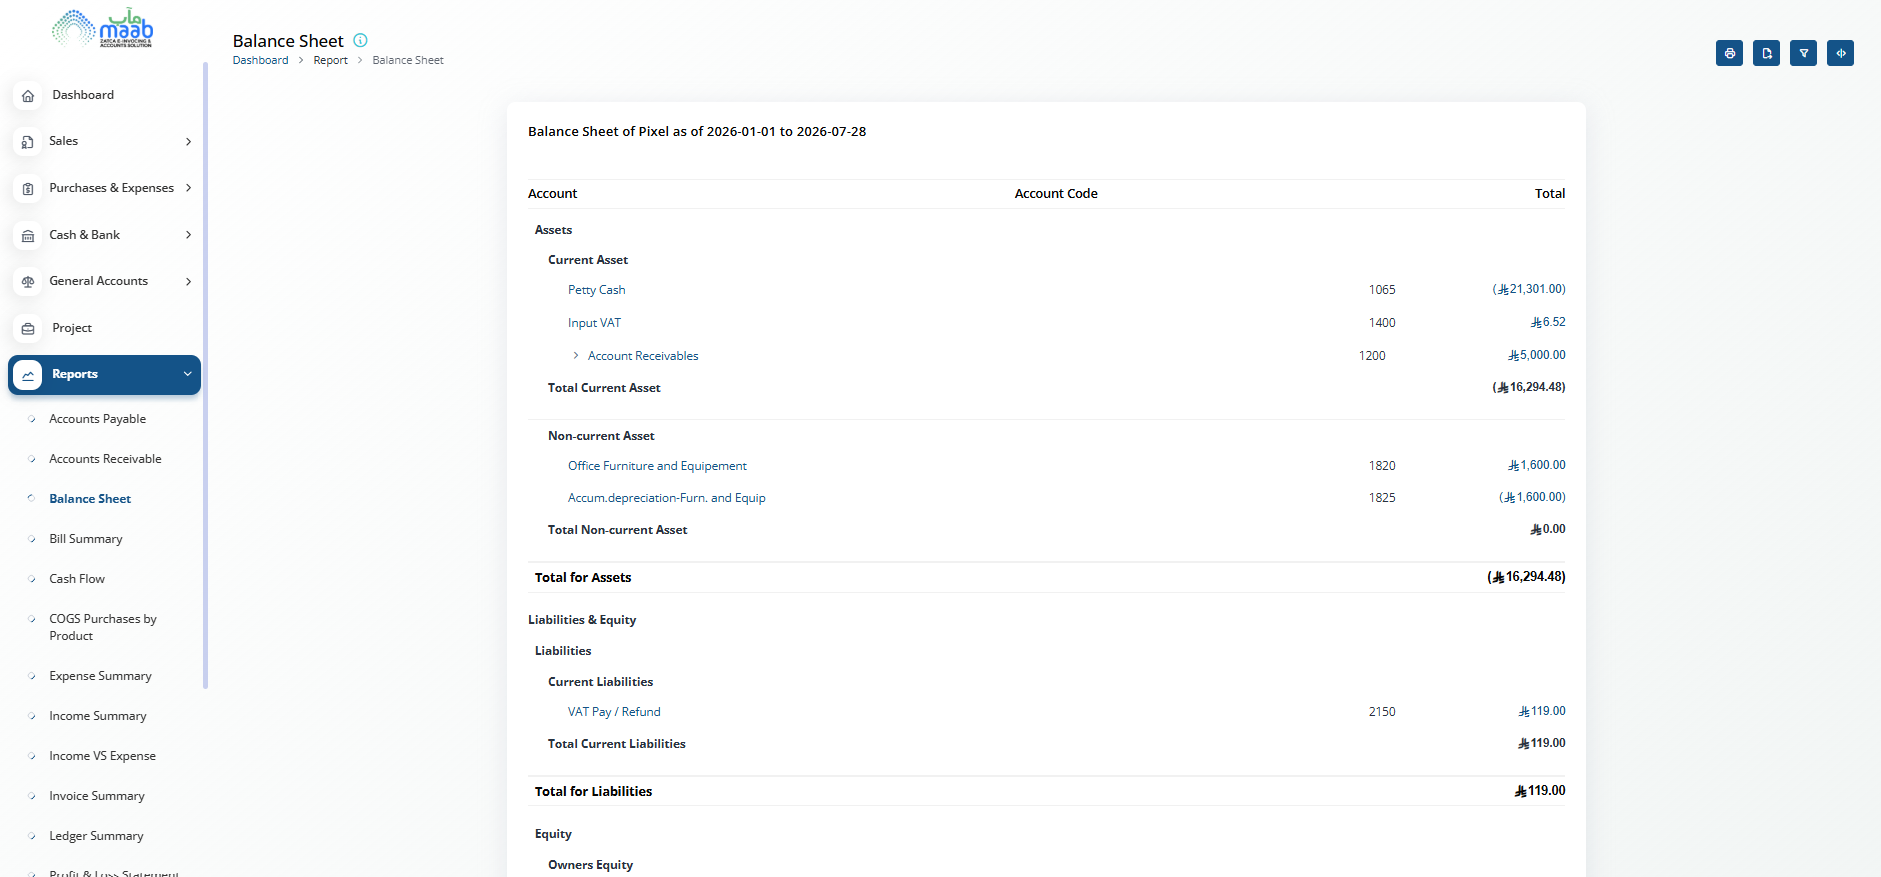
Balance Sheet
Balance Sheet & P&L ZATCA Tax Summary Cash Flow Tracking Export-Ready
Why MAAB Reports

Built to give finance teams instant, accurate visibility

MAAB compiles data from every module � invoices, bills, expenses, and journal entries � giving you a complete picture of your financial position on demand.

Financial Statements

Generate Balance Sheets, Profit & Loss Statements, Trial Balances, and Cash Flow reports on demand. Filter by date range to view figures based on your posted entries.

  • Balance Sheet & Profit & Loss Statement
  • Trial Balance showing debit and credit per account
  • Monthly Cash Flow showing income vs expense and net profit

Tax & Compliance Reports

Review VAT collected on sales and VAT paid on purchases. Tax Summary shows monthly income and expense tax by category. Tax Payable shows Output VAT vs Input VAT with the net amount owed for the period.

  • Tax Summary by period
  • Tax Payable with output vs input breakdown
  • ZATCA-aligned reporting structure

Operational Reports

Monitor invoice and bill performance, track receivables and payables aging, and review income vs expense trends. All generated on demand from a single reporting suite.

  • Accounts Receivable & Payable aging
  • Invoice, Bill & Expense summaries
  • Income vs Expense & Ledger Summary
Monthly Cash Flow Jan � Jul 2026
Total Income284,500
Total Expenses139,200
Net Profit145,300
Tax Payable 2026
Output VAT (Sales)42,675
Input VAT (Purchases)17,890
Net VAT Payable24,785
Accounts Receivable Live
Current (0�30 days)96,400
Overdue (31�60 days)28,100
Total Outstanding124,500
From data to decisions

Core Reporting Features

Compare your income against expenses across any period with flexible reporting intervals. View profitability at monthly, quarterly, or yearly scales, and filter by customer, vendor, or category to understand where revenue comes from and where costs go. A clear visual breakdown supports your analysis.

Trace every transaction through your accounts with a complete audit trail. View all movements by account, date range, or reporting period. A running balance shows exactly how each transaction affected your account position.

Understand your product costs and spending patterns at a glance. Group costs by category or drill down to individual items. Track spending over any period to optimize purchasing and inventory management decisions.

Every report is auditor-ready and export-ready in professional format. Share directly with stakeholders, auditors, and management without manual cleanup or data compilation.
Live data � Jul 2026
Income vs Expense
Total Revenue 284,500
Total Expenses 119,200
Net Profit (58% margin) 165,300
Sales Revenue284,500
VAT Payable24,785
Full Report Catalogue

17 reports covering every angle of your business

Every report pulls from your live data. No exports, no manual compilation, no waiting.

Financial Statements
  • Profit & Loss Statement
  • Balance Sheet
  • Cash Flow
  • Trial Balance
  • Ledger Summary
Tax & Compliance
  • Tax Summary
  • Tax Payable
  • Transaction Report
Receivables & Payables
  • Invoice Summary
  • Accounts Receivable
  • Bill Summary
  • Accounts Payable
Operational
  • Expense Summary
  • Income Summary
  • Income vs Expense
  • Product Stock
  • COGS by Product
FAQ

Common questions about MAAB Reports

Yes. Every report in MAAB reflects your latest posted transactions. There is no batch processing or end-of-day refresh. As soon as a journal entry is posted, it appears in the relevant reports immediately.

Yes. All reports support export to standard formats. The output is structured and formatted for external review, making it straightforward to share with auditors, accountants, or management without additional reformatting.

Yes. Most reports support date range filtering, and relevant reports also allow filtering by account, category, customer, or vendor. This lets you produce period-specific or entity-specific views without any manual data manipulation.

The Tax Payable report shows Output VAT collected on sales invoices against Input VAT paid on vendor bills, with the net VAT payable for the selected period. The Tax Summary report breaks down monthly income and expense tax by category and rate. Both reports are generated on demand and support your ZATCA filing cycle.
Ready to see your full financial picture?

Stop compiling reports manually. Let MAAB do it instantly.

Every report your finance team needs, from Balance Sheets to Tax Summaries, generated in real time from your live data, with no spreadsheets required.